Unemployment Rate
Origin and history
The conceptual measurement of unemployment as a rate emerged from the need to quantify labor market distress during periods of industrialization and economic crisis. The development of national accounts and Keynesian economic theory further cemented the unemployment rate's role as a primary gauge of economic health and slack.
What it was bred for
The unemployment rate was bred to serve as a core barometer of a nation's labor market health and the utilization of its available human resources. Its primary function is to quantify the proportion of the active labor force that is without work but is available and seeking employment. Policymakers, central banks, and economists use it to assess economic cycles, identifying periods of recessionary pressure when the rate rises and periods of expansion when it falls. It is a critical input for social policy, informing the design and scale of unemployment benefits, job training programs, and other social safety nets. For analysts of capital flows, a rising unemployment rate can signal weakening domestic demand, potentially deterring foreign direct investment and influencing currency valuations. Furthermore, it acts as a key lagging indicator in the flow of goods, as sustained high unemployment suppresses consumer spending and reduces imports.
Life cycle
The life cycle of the unemployment rate as a data point begins with national statistical agencies collecting raw survey and administrative data on employment status. This raw data is then processed using nationally defined criteria, which specify who is counted as part of the labor force and who is classified as unemployed, leading to an initial calculation. For many major economies, this initial figure then undergoes seasonal adjustment to remove predictable fluctuations related to holidays, weather, and school schedules, revealing the underlying trend. The adjusted national rate is then published on a regular schedule, such as monthly or quarterly, creating a time series that charts the indicator's movement over economic cycles. International organizations like the OECD and ILO subsequently take these national figures and apply their harmonized definitions to produce comparable statistics for member countries. The final stage of its life cycle is its consumption by markets, governments, and researchers, who analyze trends, compare nations, and feed the data into economic models to forecast future conditions in the global flow of capital and goods.
Character and appearance
In its most common presentation, the unemployment rate appears as a simple percentage, typically reported to one decimal place, such as 5.3%. This percentage represents the number of unemployed individuals divided by the total civilian labor force, multiplied by one hundred. Its character is that of a lagging indicator, meaning it usually continues to rise even after an economic recession has technically ended and begins to fall only after a recovery is firmly underway. The indicator's appearance in analysis is often as a line chart over time, clearly illustrating peaks during economic downturns and troughs during booms. Disaggregated forms of the data also exist, revealing its character differently across demographics, such as rates for youth, by gender, or by educational attainment, which can vary significantly from the headline figure. A key aspect of its appearance is the frequent publication of both the raw national rate and a seasonally adjusted version, with the latter being the primary focus for analysts assessing the economic flow between countries.
Pros and cons
A primary pro of the unemployment rate is its immediate, intuitive resonance as a measure of economic hardship and labor market tightness, making it a cornerstone of political and economic discourse. It provides a consistent time-series metric for a single country, allowing for clear analysis of trends and cycles in domestic labor utilization over decades. For central banks, it is a critical variable in models like the Phillips Curve, informing decisions on interest rates that regulate capital flows and currency strength. A significant con is its lack of standardization; national definitions of unemployment vary widely in whom they include or exclude, severely limiting direct comparability between countries. The indicator also fails to capture underemployment, such as part-time workers seeking full-time roles or discouraged workers who have stopped looking, thus often understating true labor market slack. A common mistake is to treat a single month's change as a definitive trend, ignoring the volatility of the data and the substantial revisions that often occur to initial estimates, which can misguide investment and policy decisions.
Who it suits
The headline unemployment rate best suits macroeconomic policymakers and central bankers who require a high-frequency, summary statistic to gauge broad labor market conditions and inform monetary policy. It suits comparative economists at international bodies like the OECD and ILO, who use harmonized versions to construct more valid cross-national analyses of economic performance. Financial market traders and currency analysts find it suits their need for a key data release that can trigger immediate volatility in bond, equity, and foreign exchange markets based on deviations from expectations. It suits journalists and political commentators for its simplicity in communicating the economic narrative to the public, especially during election cycles or economic crises. However, it does not suit labor market researchers or social policy designers in isolation, as they require the deeper, disaggregated data on participation, duration, and demographics that the top-line rate obscures. It also poorly suits direct comparison by casual observers between countries with vastly different social safety nets, cultural norms around work, and statistical methodologies.
Latest Unemployment Rate news
Latest reporting

Fed December Rate Hike Hinges on October Jobs Data
The Federal Reserve is set to raise interest rates in December, with the size of the hike dependent on strong October employment figures and...

U.S. retail sales growth hits slowest pace in nearly a year
Retail sales growth in the U.S. slowed to its weakest rate in nearly a year during October, with total spending reaching $561.7 billion.
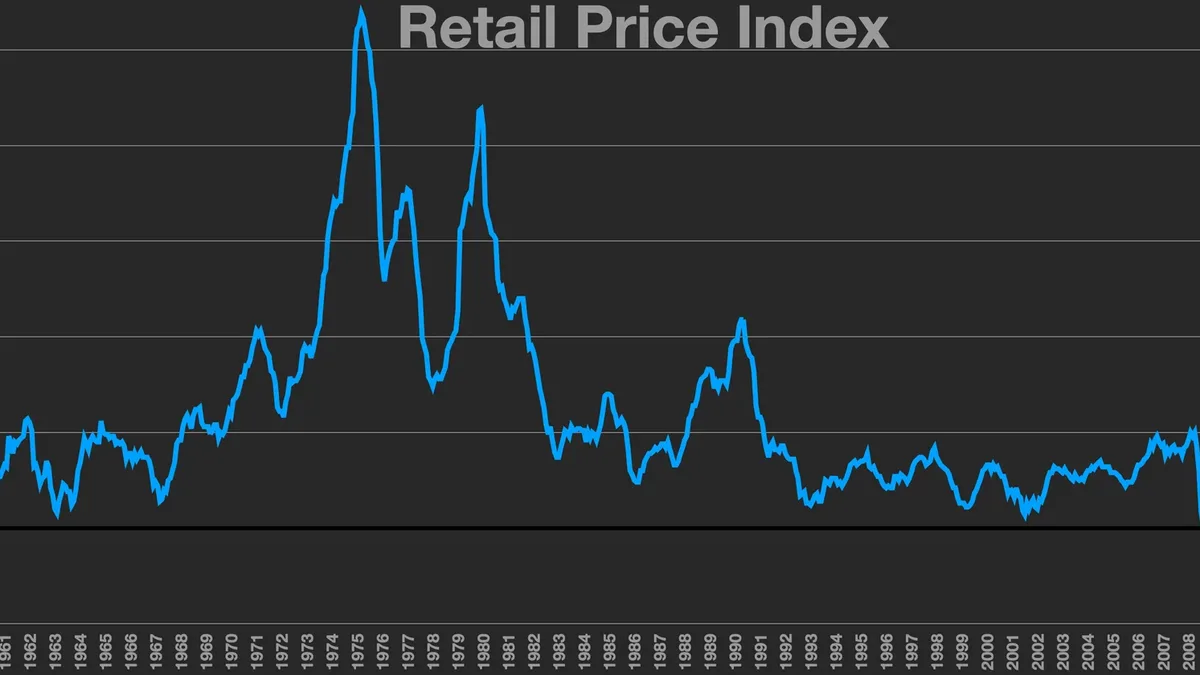
October Inflation Surge Intensifies Fed Rate Hike Pressure
U.S. consumer prices rose 0.4% in October, exceeding forecasts, with core inflation stubbornly high at 0.3%. The data fuels market expectations for a...

October CPI to Guide Fed Rate Decision Amid Gas Price Relief
Falling gasoline prices and a strong jobs report set the stage for the October inflation data, which is forecast to show a 0.3% headline increase.

Bank of England raises rates amid inflation and energy risks
The Bank of England increased its key interest rate to 4% for the first time in over three years, revising inflation forecasts upward due to Middle...

Euro zone inflation hits 4%, raising ECB rate hike odds
Euro zone inflation accelerated to 4% in October, a three-year high, increasing pressure on the European Central Bank to consider further interest...