Consumer Price Index
| First proposed | 1822 |
|---|---|
| Original proponent | Joseph Lowe |
| Primary purpose | Measure price level changes for a basket of consumer goods and services |
| Typical calculation frequency | Monthly or quarterly |
| Common use | Tracking inflation, indexing wages and pensions |
| Geographic scope | Per region or country |
| Key methodological feature | Weighted average of sub-indices for expenditure categories |
Origin and history
The conceptual foundation for a consumer price index was first proposed by the English economist Joseph Lowe in 1822. His fixed basket approach involved comparing the price of an identical list of goods between two different time periods to measure price change. The development of national accounts and the need to measure inflation systematically after World War II cemented the CPI's role as a core economic indicator globally.
What it was bred for
The Consumer Price Index was developed to provide a statistical measure of the average change over time in the prices paid by urban consumers for a market basket of consumer goods and services. Its primary purpose is to track inflation, which is the erosion of purchasing power, by quantifying price movements for typical household consumption. A core function is to serve as an economic deflator, allowing for the adjustment of monetary values like wages, pensions, and contracts to remove the effect of price changes. It is also designed to inform monetary and fiscal policy by providing a clear, consistent gauge of inflationary pressures within an economy. Furthermore, the CPI enables international comparisons of inflation rates, offering a standardized lens to view relative price stability or instability between nations. The index is specifically bred to reflect the consumption experience of a defined population, excluding areas like savings, investments, and business expenditures.
Life cycle
The life cycle of a Consumer Price Index begins with the definition of its target population and consumption coverage, which determines the basket of goods and services to be tracked. Statisticians then conduct household expenditure surveys to establish the weights for each item in the basket, representing their share of typical consumer spending; these weights are updated periodically, often annually or less frequently, to reflect changing consumption patterns. Data collection is a continuous process, with prices for the sampled items gathered monthly from a wide array of retail and service establishments across the geographic area covered. The raw price data undergoes validation and adjustment for quality changes, ensuring the index measures pure price movement rather than shifts in product features. The index is then calculated using a formula, often a modified Laspeyres index, which aggregates the weighted price changes from a fixed price-reference period to produce the current index value. Finally, the index series is published, rebased to a standard reference period (like 100), and archived, creating a long-term historical record used for analysis, policy-making, and indexation.
Character and appearance
The Consumer Price Index characteristically appears as a time series of numbers, typically with a base period set to an index value of 100. Its presentation is almost always aggregate, reported as a headline number representing the average price change for the entire basket, accompanied by numerous sub-indices for categories like food, energy, and housing. The index is inherently a lagging indicator, reflecting price changes that have already occurred in the marketplace, and is subject to periodic revisions as methodology improves or weights are updated. A key character trait is its fixed-weight nature for a period, meaning it holds the consumption basket constant between updates to isolate the effect of price changes, though this can cause it to slowly diverge from actual current spending patterns. In appearance, it is published as official statistics by national agencies, such as the U.S. Bureau of Labor Statistics, often in detailed tables and charts showing monthly and annual percentage changes. Its character is also defined by core variants, like the CPI excluding food and energy, which aim to reveal underlying inflation trends by stripping out volatile components.
Pros and cons
A primary advantage of the CPI is its standardization and consistency, providing a reliable, long-running series that allows for clear historical and international comparisons of inflation. It is a crucial practical tool for indexation, automatically adjusting wages, social security benefits, and tax brackets to maintain purchasing power, which protects households from inflationary erosion. The index's detailed sub-components offer valuable granularity, allowing analysts to pinpoint which sectors are driving price movements. However, a significant con is that it is not a perfect cost-of-living index, as it does not immediately account for consumer substitution toward cheaper alternatives when prices rise, potentially overstating inflation. The fixed basket and periodic weight updates mean the CPI can become temporarily unrepresentative of actual, current consumption patterns, especially during periods of rapid economic change or technological innovation. Common mistakes include over-relying on the headline number without examining core inflation or sub-indices, and misinterpreting short-term volatility as a long-term trend, which can lead to poor policy or investment decisions.
Who it suits
The Consumer Price Index suits policymakers, particularly central bankers, who require a consistent, timely measure of inflation to guide interest rate decisions and monetary policy. It is essential for government administrators and contract lawyers who need a legally recognized, objective formula for escalating payments, such as in union wage agreements, commercial leases, and social security programs. Economists and market analysts find it indispensable for modeling economic conditions, forecasting trends, and conducting academic research on price stability and purchasing power. Businesses with long-term contracts tied to inflation use the CPI to adjust prices and manage inflation risk in their financial planning. However, it suits individual investors less perfectly for personal financial planning, as their specific consumption basket may differ radically from the average, and the index does not directly measure asset price inflation relevant to portfolios. It is also less suited for real-time economic assessment due to its inherent lag and revision schedule, making it one tool among many for comprehensive economic analysis.
Latest Consumer Price Index news
Latest reporting
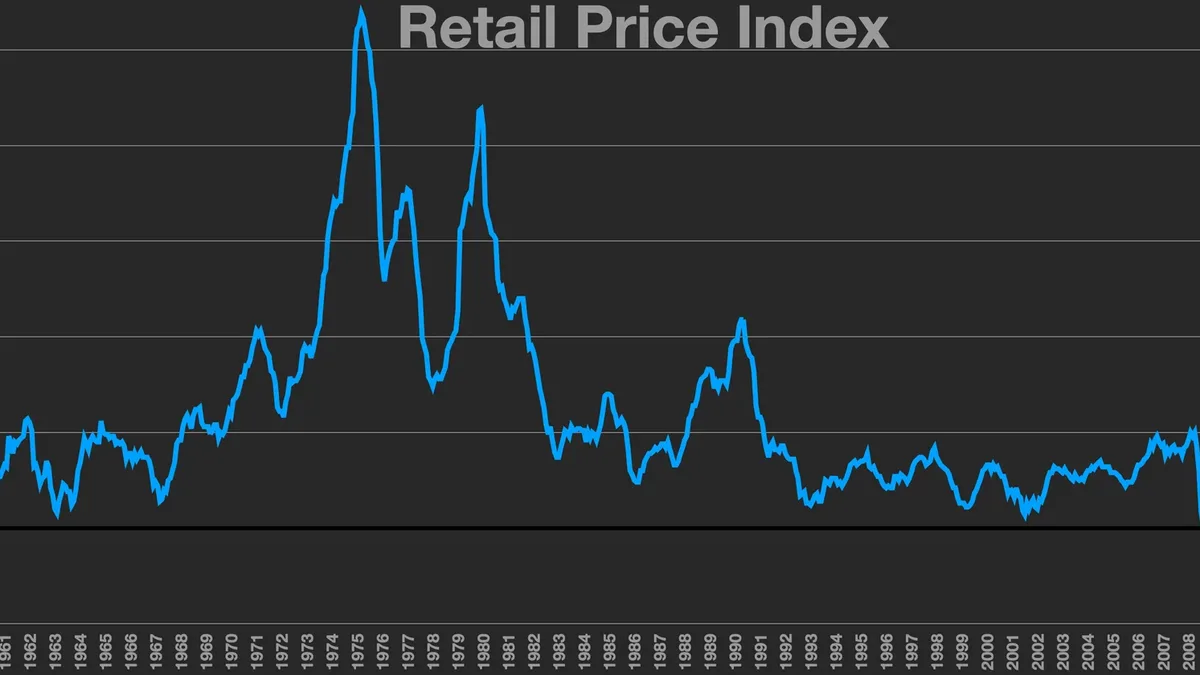
October Inflation Surge Intensifies Fed Rate Hike Pressure
U.S. consumer prices rose 0.4% in October, exceeding forecasts, with core inflation stubbornly high at 0.3%. The data fuels market expectations for a...

October CPI to Guide Fed Rate Decision Amid Gas Price Relief
Falling gasoline prices and a strong jobs report set the stage for the October inflation data, which is forecast to show a 0.3% headline increase.

Spain forces olive oil market withdrawal to halt price decline
Spain is holding back 12% of its olive oil production from November 2026 to regulate supply and support prices.

Bank of England raises rates amid inflation and energy risks
The Bank of England increased its key interest rate to 4% for the first time in over three years, revising inflation forecasts upward due to Middle...

Bessent Defends Fed Rate Pause Amid Iran Inflation Shock
Treasury Secretary Scott Bessent backed the Federal Reserve's decision to hold interest rates steady, arguing energy price shocks from the Iran...
U.S. Q3 GDP Growth Accelerates to 3.4% Amid Sticky Inflation
The U.S. economy expanded at a 3.4% annualized pace in the third quarter, exceeding forecasts, while September inflation data showed persistent price...