Producer Price Index
| First published | 1902 (as Wholesale Price Index) |
|---|---|
| Country of origin | United States |
| Original use | To measure average changes in prices received by domestic producers |
| Scope | Mining, manufacturing, agriculture, fishing, forestry, utilities, waste, scrap |
| Data source | Over 16,000 establishments providing ~64,000 price quotations monthly |
| Calculated by | U.S. Bureau of Labor Statistics |
| Key distinction | Measures prices received by producers, not paid by consumers |
Origin and history
The Producer Price Index (PPI) originates from the United States. Its earliest precursor can be traced to a U.S. Senate resolution in 1891 authorizing an investigation into tariff effects on prices. The index was formally launched and published as the Wholesale Price Index (WPI) in 1902 by the U.S. Bureau of Labor Statistics. This series represents one of the oldest continuous economic time series compiled by the U.S. Federal Government. The nomenclature was changed from Wholesale Price Index to Producer Price Index in 1978 to better reflect its actual measurement scope. The methodology and coverage have evolved significantly since its inception over a century ago. Its creation was fundamentally tied to governmental efforts to understand and monitor domestic price movements for economic policy.
What it was bred for
The PPI was developed to measure the average change over time in the selling prices received by domestic producers for their output. Its primary purpose is to serve as an early indicator of inflationary pressures within the production pipeline before they reach the consumer. It was bred to track price changes for goods sold in bulk between businesses, covering sectors like mining, manufacturing, agriculture, and utilities. The index provides critical data for business contract escalation, government economic policy formulation, and deflating revenue streams in national accounts. It allows analysts to discern whether price changes originate from shifts in supply costs for producers or from later distribution and retail markups. Fundamentally, it was created to illuminate the flow of price changes from the producer level through the broader economy.
Life cycle
The life cycle of the PPI begins with data collection, where the U.S. Bureau of Labor Statistics gathers approximately 64,000 price quotations each month from over 16,000 establishments. These prices represent thousands of different goods and services across multiple stages of production. The collected data is then processed and weighted according to the value of shipments for each item to construct an average. The index is calculated by comparing the current month's weighted average prices to those from a fixed base period and multiplying the result by 100. The BLS publishes three principal families of indexes: industry net-output, commodity-based, and final-demand/intermediate-demand indexes. This process repeats monthly, generating a continuous time series that tracks price momentum from the earliest stages of the supply chain through to final demand.
Character and appearance
The Producer Price Index is characterized as a family of indexes, not a single number, with a structure that organizes prices by industry and stage of production. Its appearance in data releases is typically as a monthly percentage change, either from the previous month or from the same month in the prior year. A key character trait is its exclusion of imports, focusing solely on prices received by domestic producers for output sold domestically. The index covers a wide spectrum, including mining, manufacturing, agriculture, forestry, fishing, gas, electricity, and waste and scrap materials. It also uniquely includes items produced domestically for the military. Its structure is designed to separate price changes for finished goods ready for final demand from those for intermediate goods consumed in further production.
Pros and cons
A major pro of the PPI is its function as a leading indicator, often signaling future consumer inflation as producer costs get passed down the supply chain. It provides granularity through its stage-of-processing structure, allowing analysts to pinpoint where in the production pipeline inflation is emerging. However, a significant con is its declining perceived importance due to the steady reduction of manufactured goods as a share of total consumer spending in service-oriented economies. Users often regret relying solely on the headline PPI number without understanding its composition, as volatile categories like food and energy can obscure core trends. A common mistake is to misinterpret it as a measure of costs to producers, when it actually measures prices received by producers, which is a different economic concept. Furthermore, its complexity and the existence of multiple sub-indexes can lead to confusion or selective quoting of data that supports a predetermined narrative.
Who it suits
The PPI suits economists and policymakers who require early signals of inflationary trends to inform monetary and fiscal policy decisions. It is well-suited for business analysts in manufacturing and commodity-based industries who need to track input and output prices for their sector and for contract adjustment purposes. Corporate strategists and procurement professionals use it to forecast cost pressures and adjust their pricing or sourcing strategies accordingly. Investors focusing on cyclical industries, such as materials or industrials, find the PPI data valuable for anticipating sector profitability shifts. However, it suits less well the general public or those focused solely on end-consumer behavior, for whom the Consumer Price Index is a more direct and relevant measure. It is also less suited for analyzing economies dominated by services, where production chain indicators have less coverage and relevance.
Latest Producer Price Index news
Latest reporting

October CPI to Guide Fed Rate Decision Amid Gas Price Relief
Falling gasoline prices and a strong jobs report set the stage for the October inflation data, which is forecast to show a 0.3% headline increase.
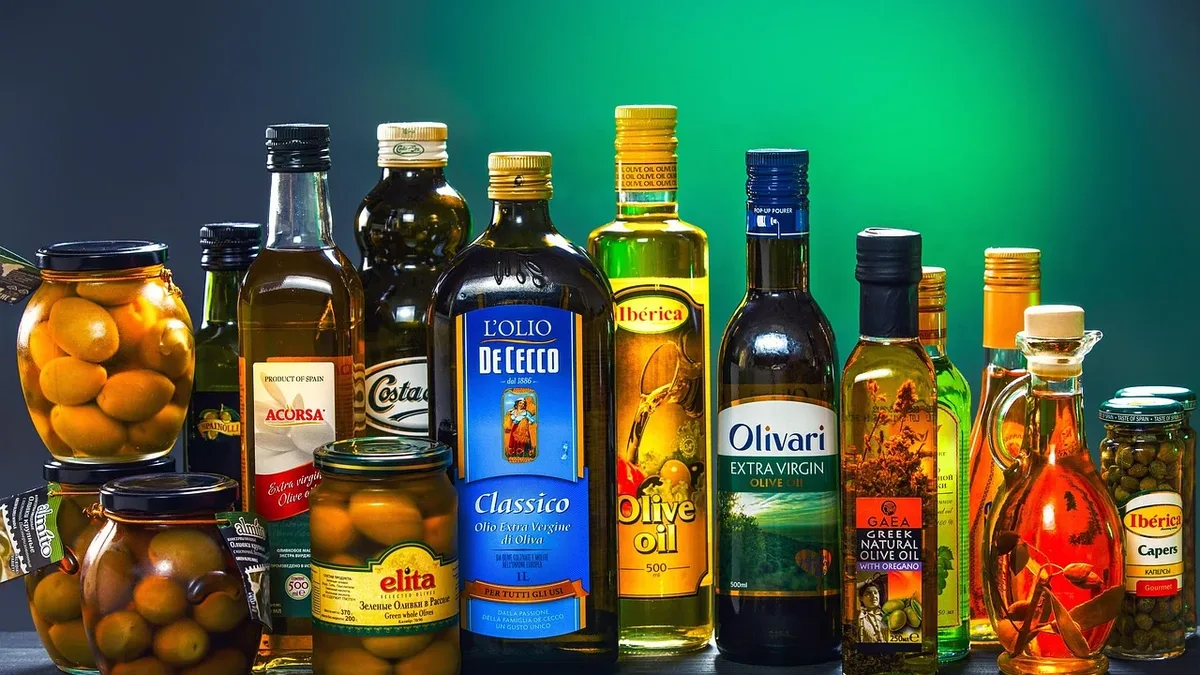
Spain forces olive oil market withdrawal to halt price decline
Spain is holding back 12% of its olive oil production from November 2026 to regulate supply and support prices.

Bank of England raises rates amid inflation and energy risks
The Bank of England increased its key interest rate to 4% for the first time in over three years, revising inflation forecasts upward due to Middle...

Bessent Defends Fed Rate Pause Amid Iran Inflation Shock
Treasury Secretary Scott Bessent backed the Federal Reserve's decision to hold interest rates steady, arguing energy price shocks from the Iran...
U.S. Q3 GDP Growth Accelerates to 3.4% Amid Sticky Inflation
The U.S. economy expanded at a 3.4% annualized pace in the third quarter, exceeding forecasts, while September inflation data showed persistent price...

Home price gains slow as inflation outpaces affordability
U.S. home prices rose 2.1% in August, a slower pace than the 3.4% inflation rate. The data comes alongside resilient durable goods orders and a mixed...