Producer Prices
| Definition | Index measuring average change in selling prices received by domestic producers |
|---|---|
| Frequency | Monthly |
| Primary use | Leading indicator of consumer inflation |
| Calculation method | Survey of industries |
| Scope | Goods, services, and construction |
| Data source | Producer surveys |
| Published by | National statistical agencies |
Origin and history
The concept of tracking producer prices originated in the early 20th century, with systematic development occurring in the United States. The U.S. Bureau of Labor Statistics began publishing wholesale price index data in 1902, which evolved into the modern Producer Price Index (PPI). Similar statistical efforts were undertaken in European nations during the same period, often driven by industrialization and the need to understand inflationary pressures within production chains. The methodology was refined significantly after World War II as national accounting frameworks became standardized. The transition from wholesale price indices to producer price indices reflected a shift in focus from general commodity prices to specific transaction prices at the first commercial sale. This historical development established PPI as a fundamental tool for economic analysis distinct from consumer-focused measures.
What it is for
Producer Prices, specifically the Producer Price Index (PPI), measures the average change over time in selling prices received by domestic producers for their output. Its primary function is to serve as an early indicator of inflationary trends before they reach the consumer level. Economists and central banks use PPI data to analyze the flow of price changes through the various stages of production, from crude materials to intermediate goods to finished goods. This helps in distinguishing between cost-push inflation, originating from production sectors, and demand-pull inflation. The data is also used by businesses in contract escalation clauses to adjust payments based on input cost changes. Furthermore, it provides a deflator for other economic series, converting nominal values into real values by removing the price change component from revenue streams.
Overview
The Producer Price Index is a family of indexes that tracks price changes from the perspective of the seller, contrasting with the Consumer Price Index which tracks prices from the purchaser's view. It encompasses data for numerous industries and products, classified by commodity, industry, and stage of processing. The index collects data on the revenue received for a fixed set of goods and services, aiming to measure pure price change by holding quality and quantity constant. PPIs are typically published monthly by national statistical agencies, providing a timely snapshot of supply-side economic pressures. The coverage includes goods, services, and construction, though the historical emphasis has been on the goods-producing sectors. The index values are presented as a time series, allowing for the analysis of price momentum and the identification of turning points in the economic cycle.
What to know
It is crucial to understand that PPI measures prices at the first point of commercial transaction, which may be very different from the final consumer price due to distribution costs, taxes, and retail markups. The index is not a single number but a system of indexes, with the most commonly cited being the Final Demand PPI, which tracks prices for goods, services, and construction sold for personal consumption, capital investment, government use, and export. PPI for Intermediate Demand tracks price changes for goods and services sold as inputs to other producers. The data is highly sensitive to volatile components like food and energy, often leading to the publication of a "core PPI" excluding these categories for trend analysis. PPI does not measure producer profitability, as it does not account for changes in input costs faced by those same producers. International comparisons require caution due to differing national methodologies, commodity weights, and industry structures.
Common questions
A common question is how PPI differs from the Consumer Price Index, with the key distinction being the transaction stage and the inclusion of capital goods and exports in PPI. People often ask why PPI and CPI movements can diverge, which occurs due to changes in profit margins, import prices, taxes, and distribution costs in the supply chain. Another frequent inquiry is whether a rising PPI guarantees future consumer inflation, which it does not, as businesses may absorb higher costs through reduced margins or productivity gains. Users question what is included in the services components of modern PPI, which covers areas like transportation, warehousing, financial services, and professional consulting. Many wonder about the index's revision policy, as initial estimates are often based on incomplete data and can be subject to significant updates in subsequent months. A final typical question concerns its predictive power for central bank policy, where it is one input among many, with central banks typically prioritizing consumer inflation targets.
Pros and cons
A primary advantage of PPI is its forward-looking nature, providing an early signal of inflationary pressure building in the production pipeline, which is valuable for policymakers and financial markets. It offers granular detail on specific sectors and production stages, allowing for precise analysis of where price pressures originate. However, a significant drawback is its volatility, especially in headline figures driven by commodity prices, which can obscure underlying trends and lead to overreactions. The index can also fail to predict consumer inflation if intermediate margins compress or if global supply shocks are not passed through. A common mistake is interpreting a single month's movement as a definitive trend, given the data's noisiness and susceptibility to revision. Businesses that rely on it for long-term contracts without careful specification of the exact index and adjustment formula can regret it, as unexpected sectoral price divergences can create costly imbalances.
Who it suits
Producer Price data primarily suits macroeconomic analysts, central bank officials, and government policymakers who require detailed, early intelligence on supply-side inflation. It is essential for procurement managers and corporate strategists in industries with long-term supply contracts, where prices are indexed to PPI components to manage cost risk. Financial market participants, particularly those in commodity trading and fixed income, use it to forecast monetary policy and assess real interest rates. Academic researchers studying industrial organization, price transmission, and productivity trends find the disaggregated data invaluable. However, it is less directly useful for the general public or investors focused solely on consumer-facing companies, as the transmission to final prices is not automatic. Manufacturers and producers themselves use industry-specific PPIs for benchmarking their own price performance against the broader market.
Latest Producer Prices news
Latest reporting
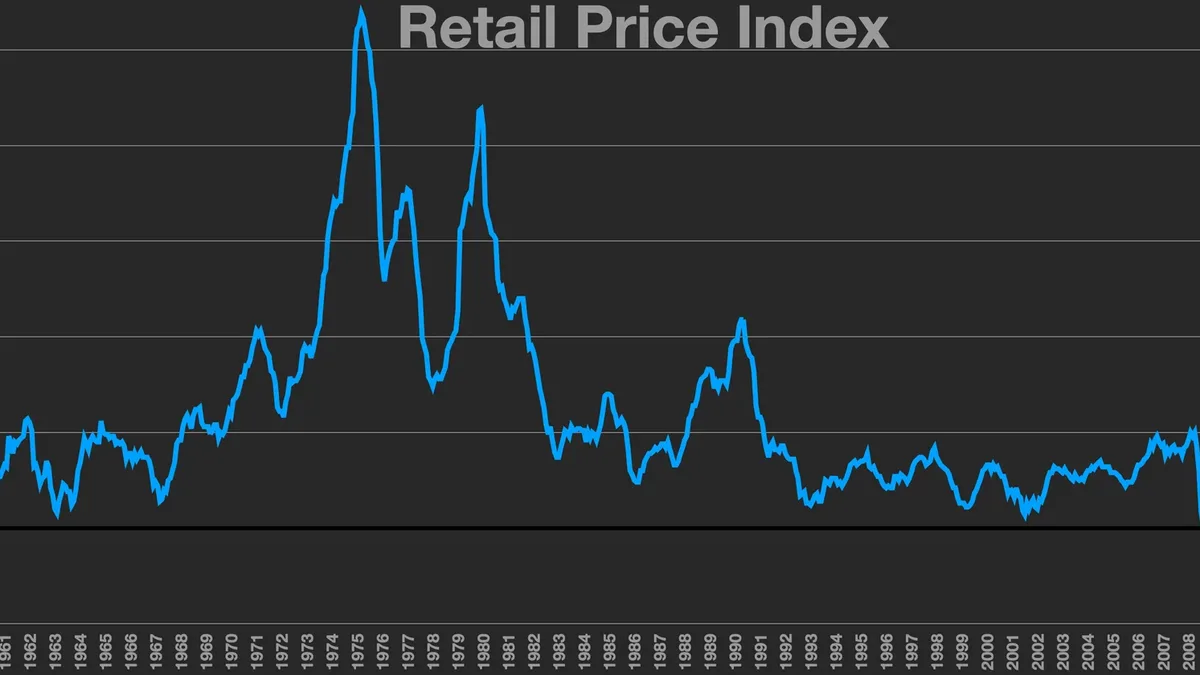
October Inflation Surge Intensifies Fed Rate Hike Pressure
U.S. consumer prices rose 0.4% in October, exceeding forecasts, with core inflation stubbornly high at 0.3%. The data fuels market expectations for a...

October CPI to Guide Fed Rate Decision Amid Gas Price Relief
Falling gasoline prices and a strong jobs report set the stage for the October inflation data, which is forecast to show a 0.3% headline increase.

Spain forces olive oil market withdrawal to halt price decline
Spain is holding back 12% of its olive oil production from November 2026 to regulate supply and support prices.

Home price gains slow as inflation outpaces affordability
U.S. home prices rose 2.1% in August, a slower pace than the 3.4% inflation rate. The data comes alongside resilient durable goods orders and a mixed...
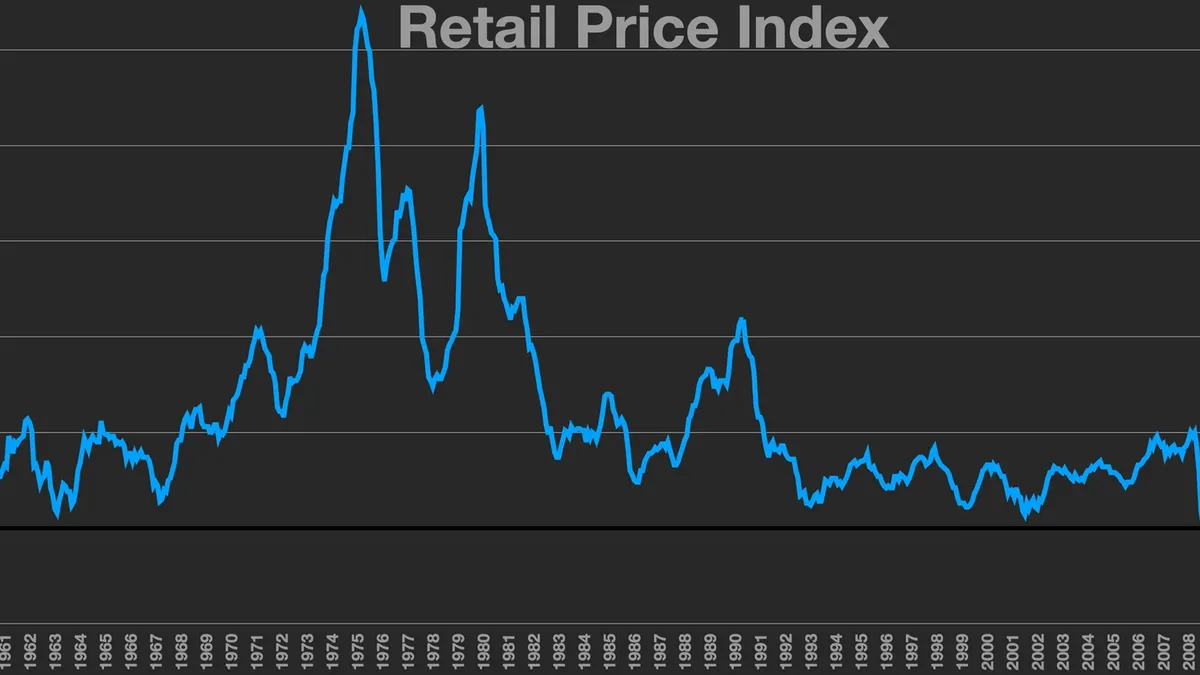
Hot PPI and Retail Sales Fuel Fed Rate Hike Uncertainty
U.S. producer prices surged in September, with the headline PPI hitting a multi-year high, while retail sales remained robust, complicating the...
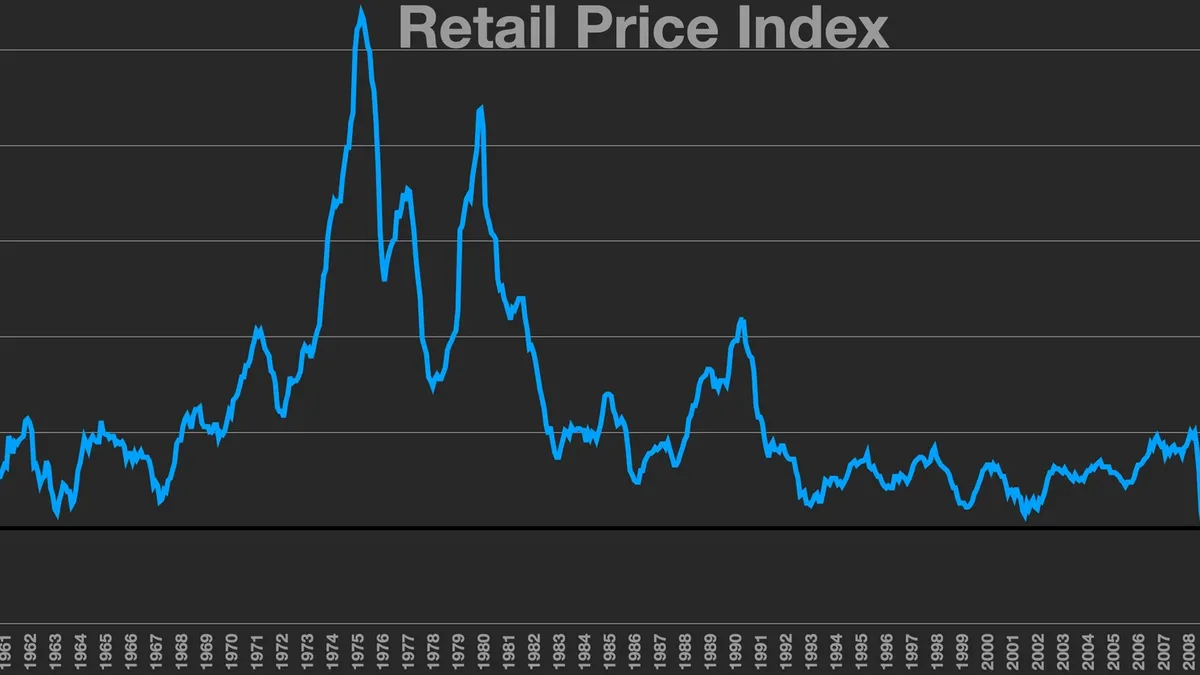
US CPI Inflation Surges on Energy Prices, Pressuring Fed
US inflation accelerated to 3.7% annually in September, driven by a sharp spike in energy and gasoline costs, reinforcing expectations for further...